 Image: Numbers_graph.png by surachetch
Although the next two weeks are scheduled for you to analyse the data you have collected, most of you will not be at this stage. However, you can still have a look at some of the material and start thinking about how you are going to analyse and organise your results. Remember to give feedback to at least two others on their evaluation plans.
Things to do:
- View the presentation called Preparing evaluation results - questionnaire responses.
- To view the presentation in full screen click the icon at the bottom right of the slide.
- You can also look at the spreadsheet Descriptive statistics % Frequencies which accompanies the presentation to see how some samples of data have been analysed.
- Look at Helga Wientjes' draft evaluation report. Unfortunately some of the Figures are not appearing - unfortunately Helga is away so permission cannot be obtained to access the other Figures but there are some there to look at.
- Investigate some other examples of results and reports in the Resources area to see what others have done.
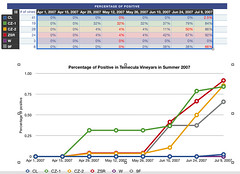
- Decide how you will present your data - tables, graphs (what type of graph).
Post your initial ideas to your blog and ask for help if you need enlightenment.
- Write descriptively about your results - again check out some examples.
- Submit a draft of your results to the lecturer via Digital Dropbox, your blog or via email.Remember to notify the lecturer on email when this is done.
- Post a summary of your results to your blog.
- Provide feedback to at least two other people on their blogs.

No comments:
Post a Comment